Cross-Modal Brain Graph Transformer via Function-Structure Connectivity Network for Brain Disease Diagnosis
Multi-modal brain networks represent the complex connectivity between different brain regions from both functional and structural perspectives, which is of great significance for brain disease diagnosis.
Background & Academic Lineage
The Origin & Academic Lineage
The problem addressed in this paper originates from the broader field of brain network analysis, which leverages neuroimaging data to understand the intricate connections within the brain and their implications for disease diagnosis. Historically, the academic field recognized two primary types of brain networks: functional connectivity networks (FCNs), derived from functional magnetic resonance imaging (fMRI) signals reflecting synchronized brain activity, and structural connectivity networks (SCNs), built from diffusion tensor imaging (DTI) data representing physical fiber tracts.
Early research established that both FCNs and SCNs provide complementary information about brain function and structure. However, a significant "pain point" emerged: effectively combining and leveraging this complementary information to enhance the accuracy of brain disease diagnosis proved challenging. Existing methods were often limited to simple feature-level fusion, failing to fully exploit the rich, interdependent relationships between these two modalities. Furthermore, brain diseases often manifest through complex, long-range dependencies across brain regions. Traditional graph neural networks (GNNs), while powerful, primarily focus on local information propagation, making them less effective at capturing these widespread, non-local interactions.
The advent of Transformer architectures, with their inherent self-attention mechanisms, offered a promising avenue for modeling long-range dependencies. However, initial applications of Transformers to brain networks, such as BrainNetTF [13], still overlooked the crucial interdependence between functional and structural connectivity. Similarly, multi-modal approaches like BrainNN [29] treated FCNs and SCNs as separate "views" but often neglected the supportive role of structural connectivity in shaping functional interactions, and again, struggled with capturing extensive long-range dependencies. This fundamental limitation—the inability to fully integrate and exploit the complementary, interdependent, and long-range information across functional and structural brain networks—is precisely what compelled the authors to develop their cross-modal brain graph Transformer.
Intuitive Domain Terms
- Functional Connectivity Network (FCN): Imagine your brain as a bustling city. An FCN is like a map showing which neighborhoods (brain regions) are "talking" to each other a lot, even if there isn't a direct road between them. It's about how their activities are synchronized, like two distant friends who always call each other at the exact same time every day.
- Structural Connectivity Network (SCN): Continuing the city analogy, an SCN is the actual road map, showing all the physical highways and streets (nerve fiber tracts) that directly connect different neighborhoods. It's the physical infrastructure that allows communication.
- Regions of Interest (ROIs): These are like the individual, predefined neighborhoods or districts within our brain city. Scientists divide the brain into these specific zones to study their functions and connections.
- Cross-modal: This term means combining information from different "senses" or types of data. In this paper, it's like using both the "phone call traffic map" (FCN) and the "physical road map" (SCN) of the brain city to get a much more complete and accurate understanding of how it operates, rather than just relying on one.
- Transformer (in this context): Think of a Transformer as a very smart detective who can connect clues from all over the brain city, not just the ones right next to each other. It's particularly good at finding subtle, long-distance relationships and influences that might be missed by a detective who only looks at immediate neighbors.
Notation Table
| Notation | Description |
|---|---|
Problem Definition & Constraints
Core Problem Formulation & The Dilemma
The core problem this paper addresses is the accurate diagnosis of brain diseases by effectively leveraging multi-modal brain network information.
Input/Current State:
Existing methods for brain disease diagnosis utilize multi-modal brain networks, specifically functional connectivity (FC) derived from fMRI and structural connectivity (SC) derived from DTI. These methods typically perform information fusion at the feature dimension. However, this approach is limited and fails to fully exploit the rich, complementary, and interdependent information present between FC and SC networks. Previous research has shown that FC and SC provide complementary insights, but effectively combining them to enhance diagnostic performance remains a significant challenge. Many existing Transformer-based methods for brain network analysis focus solely on FC, overlooking the crucial structural context. Similarly, multi-view learning approaches for FC and SC often neglect the supporting role of structural connectivity in functional connectivity and the widespread long-range dependencies inherent in brain networks.
Desired Endpoint (Output/Goal State):
The goal is to achieve accurate brain disease diagnosis by developing a method that can:
1. Effectively leverage the complementary information from both functional and structural connectivity networks.
2. Capture long-range dependencies within the cross-modal brain network.
3. Identify multi-modal biomarkers associated with specific brain diseases.
4. Retain significant regions of interest (ROIs) during dimensionality reduction by integrating information from both FC and SC networks, thereby preserving as much effective information as possible.
Missing Link or Mathematical Gap:
The exact missing link is a robust mathematical framework that can intrinsically integrate structural connectivity information to enhance the attention mechanism in a Transformer model, which is primarily designed for sequential or graph-like data (like FC). Furthermore, there is a gap in developing a cross-modal pooling mechanism that intelligently reduces graph size by considering the combined importance of ROIs from both functional and structural perspectives, rather than treating them as separate entities or simply concatenating features. The paper aims to bridge this by proposing a cross-modal Transformer module that uses SC features as an "enhanced mask" for attention and a cross-modal topK pooling method.
Painful Trade-off or Dilemma:
Previous researchers have been trapped by several painful trade-offs:
* Information Fusion vs. Complementarity: While fusing information from FC and SC is desirable, simply combining features in the feature dimension often leads to a loss of the unique, complementary insights and the inherent interdependence between these two modalities. Improving fusion often means sacrificing the distinct contributions of each network type.
* Local vs. Long-range Dependencies: Graph Neural Networks (GNNs) are effective for local information propagation but struggle to capture the extensive long-range dependencies present in brain networks, which are crucial for disease diagnosis. Transformers excel at long-range dependencies but are typically applied to single-modality data (e.g., only FC), thus ignoring the vital structural context that could guide attention and improve performance.
* Dimensionality Reduction vs. Information Loss: Brain networks are high-dimensional, and reducing their size through pooling is essential for computational efficiency and focusing on salient regions. However, this process often leads to the inadvertent loss of critical information, especially if pooling is performed unimodally or without a comprehensive understanding of cross-modal ROI importance. The dilemma is how to reduce graph complexity without sacrificing diagnostic accuracy by discarding important, subtle signals.
Constraints & Failure Modes
The problem of cross-modal brain graph analysis for disease diagnosis is insanely difficult due to several harsh, realistic walls:
1. Data-Driven Constraints:
* Multi-modal Data Scarcity: Obtaining comprehensive multi-modal neuroimaging data (both fMRI for FC and DTI for SC) for a sufficient number of subjects, especially for specific disease cohorts, is a significant challenge. The paper notes that for the ABIDE dataset, only 95 subjects had both fMRI and DTI data, highlighting this practical limitation.
* Data Complexity and Noise: Raw fMRI and DTI data are inherently noisy, high-dimensional, and require extensive preprocessing (e.g., DPARSF for fMRI, PANDA for DTI). Even after preprocessing, residual noise and artifacts can impact the accuracy of derived connectivity matrices.
* Skewed Structural Connectivity Distribution: The number of fiber connections ($X_{s,(i,j)}$) between ROIs, as measured by DTI, can vary widely (from zero to thousands) and exhibits a highly skewed distribution. This characteristic necessitates specific data transformations, such as logarithmic transformation (as shown in Eq. 1), to normalize the data and ensure statistical validity, adding a preprocessing complexity.
2. Computational Constraints:
* High Dimensionality of Brain Graphs: Even with parcellation into 90 ROIs, brain networks result in $N_0 \times N_0$ matrices. Processing these large graphs, particularly with Transformer architectures that have a quadratic computational complexity with respect to the number of nodes, can be extremely demanding.
* Memory Limitations: Training complex deep learning models like the proposed Cross-Modal Brain Graph Transformer (CBGT), which involves multiple layers of Transformer and pooling modules, requires substantial GPU memory. This can be a bottleneck, limiting model size or batch size. The use of an NVIDIA 3090 GPU suggests the need for high-end hardware.
* Long-range Dependency Capture: While Transformers are adept at capturing long-range dependencies, applying them to large brain graphs still incurs significant computational cost, especially when considering cross-modal interactions.
3. Methodological/Logical Constraints:
* Effective Cross-Modal Integration: The primary methodological hurdle is designing an architecture that genuinely integrates, rather than merely concatenates, information from FC and SC. The challenge lies in ensuring that SC effectively guides or enhances the processing of FC, reflecting their biological interdependence.
* Preserving Information During Pooling: Developing a pooling strategy that reduces graph size while intelligently retaining the most diagnostically relevant ROIs from both functional and structural perspectives is complex. A naive pooling method could inadvertently discard crucial information, leading to a failure in diagnostic accuracy.
* Interpretability Requirements: Beyond achieving high accuracy, brain disease diagnosis models are often expected to provide insights into which brain regions or connections are most discriminative. This adds a constraint that the model's internal mechanisms should be interpretable, allowing for the identification of multi-modal biomarkers.
* Generalizability Across Diseases and Datasets: A robust method must perform well across different brain diseases (e.g., Alzheimer's, MCI, ASD) and diverse datasets (e.g., ADNI, ABIDE), indicating a need for a highly generalizable and adaptable model architecture.
Why This Approach
The Inevitability of the Choice
The adoption of the Cross-Modal Brain Graph Transformer (CBGT) was not merely a choice but an inevitable progression driven by the inherent limitations of prior methodologies in brain disease diagnosis. The authors identified a critical gap: existing methods, even state-of-the-art (SOTA) approaches, were primarily constrained to information fusion at the feature dimension. This meant they consistently failed to fully leverage the rich, complimentary information embedded within both functional and structural connectivity networks.
Specifically, the paper highlights that the core challenge in brain disease diagnosis, particularly when analyzing brain networks, lies in modeling and learning the extensive long-range dependancies that exist between brain regions. Traditional Graph Neural Networks (GNNs), while effective for local information propagation, are inherently limited in capturing these widespread, non-local relationships. The self-attention mechanism, a hallmark of Transformer architectures, was recognized as the only viable solution for effectively capturing such long-range dependencies across nodes.
Furthermore, even when Transformers were introduced into brain network analysis (e.g., BrainNetTF [13]), they often overlooked the crucial interdependence between functional and structural connectivity networks. These earlier Transformer-based methods, while an improvement over GNNs for long-range capture, still treated modalities somewhat separately or fused them superficially, neglecting the supporting role of structural connectivity in shaping functional interactions. The authors' realization was that a truly effective model needed not just long-range attention, but cross-modal long-range attention, where structural information could directly enhance the attention mechanism applied to functional data. This specific cross-modal integration within the Transformer framework, coupled with a sophisticated pooling strategy, became the only path forward to overcome these combined limitations.
Comparative Superiority
Beyond simple performance metrics, the CBGT method demonstrates qualitative superiority through several structural advantages. Its primary strength lies in its ability to effectively capture long-range dependencies within the cross-modal brain network, a feat that traditional GNNs struggle with due to their local aggregation mechanisms. The enhanced attention mechanism, which is directly informed by key structural connectivity features, allows the model to focus on more relevant connections, thereby providing a richer and more context-aware representation of brain activity and structure. This is a significant qualitative leap over methods that treat modalities in isolation or fuse them without such deep, interactive enhancement.
Another critical structural advantage is the cross-modal topK pooling module. Unlike unimodal pooling strategies that might discard important information by focusing on only one type of connectivity, CBGT's pooling method comprehensively evaluates node importance by integrating information from both functional and structural connectivity networks. This ensures that only the most cruical regions of interest (ROIs) are retained during dimensionality reduction, preserving essential graph information and significantly improving diagnostic accuracy. This multi-faceted importance evaluation is inherently superior to methods that rely on a single modality for node selection, which could lead to suboptimal graph simplification and loss of discriminative power. While the paper does not explicitly detail memory complexity reductions in Big-O notation, the intelligent pooling mechanism implicitly contributes to managing computational load by reducing graph size while retaining maximum effective information.
Alignment with Constraints
The chosen CBGT method perfectly aligns with the inherent constraints of brain disease diagnosis, which demand a holistic understanding of brain connectivity. If we consider the problem's harsh requirements to include: (1) fully exploiting complementary multi-modal information, (2) accurately capturing long-range dependencies, and (3) identifying significant ROIs for precise diagnosis, then CBGT presents a perfect "marriage" of problem and solution.
- Complementary Multi-modal Information: The CBGT is explicitly designed to "effectively leverage the complementary information from functional and structural connectivity networks" (Abstract). Its cross-modal Transformer module integrates structural connectivity features to enhance the attention mechanism, ensuring that the interdependence between modalities is not overlooked but actively utilized.
- Long-Range Dependencies: The core of the Transformer architecture, with its self-attention mechanism, is inherently suited to capture long-range dependencies. By applying this within a cross-modal context, CBGT ensures that these global relationships are captured not just within a single modality, but across the combined functional-structural network.
- Identification of Significant ROIs: The cross-modal topK pooling module directly addresses the need to identify and retain significant ROIs. By considering node importance from both functional and structural perspectives, it ensures that the most discriminative brain regions for disease prediction are preserved, aligning perfectly with the diagnostic goal of pinpointing relevant biomarkers.
Rejection of Alternatives
The paper provides clear reasoning for rejecting several alternative approaches. A primary rejection is directed at traditional Graph Neural Networks (GNNs). The authors explicitly state that "Unlike the local information propagation mechanism of graph neural networks (GNNs) [4, 24], the self-attention mechanism in Transformer can effectively capture long-range dependencies between nodes." This highlights GNNs' fundamental limitation in modeling the extensive, non-local relationships crucial for brain network analysis, making them unsuitable as a standalone solution for this problem.
Furthermore, the paper implicitly rejects unimodal Transformer approaches or those with less sophisticated multi-modal fusion. It notes that even "brain network Transformer (BrainNetTF) [13]... overlook the interdependence between functional and structural connectivity networks." This indicates that simply applying a Transformer to one modality, or fusing modalities without deep, interactive enhancement (like using structural features to guide attention), would fail to fully exploit the rich, complementary information available. Previous multi-modal methods that were "limited to information fusion in the feature dimension" are also implicitly rejected for their inability to "fully exploit the complementary information." The CBGT's design, with its enhanced mask for attention and cross-modal pooling, directly addresses these shortcomings, demonstrating why a more integrated, cross-modal Transformer was necessary. The paper does not discuss or imply the failure of other popular generative models like GANs or Diffusion models for this specific diagnostic task, as they operate on different principles not directly relevant to the connectivity analysis problem at hand.
Mathematical & Logical Mechanism
The Master Equation
The core of the Cross-Modal Brain Graph Transformer (CBGT) lies in two primary mechanisms: the enhanced attention within the Transformer layer and the cross-modal node importance scoring for pooling. These mechanisms are mathematically captured by the following equations:
The attention score calculation, incorporating the structural connectivity mask, is given by:
$$
T^{l,z} = \text{softmax} \left( \frac{(W_Q^l X^{l-1})^T (W_K^l X^{l-1})}{\sqrt{d_K^l}} \odot (1 + M^{l-1}) \right)
$$
And the cross-modal node importance score for pooling is determined by:
$$
\tilde{S}^l = \sigma(S^l \cdot W^l + b^l)
$$
Term-by-Term Autopsy
Let's dissect these equations to understand each component's role.
For the Attention Score Equation: $T^{l,z} = \text{softmax} \left( \frac{(W_Q^l X^{l-1})^T (W_K^l X^{l-1})}{\sqrt{d_K^l}} \odot (1 + M^{l-1}) \right)$
-
$T^{l,z}$:
- Mathematical Definition: This is the attention score matrix for the $z$-th attention head within the $l$-th layer. It's a square matrix where each element $T^{l,z}_{ij}$ represents the normalized attention weight that node $i$ places on node $j$.
- Physical/Logical Role: It quantifies the relevance or importance of each brain region (ROI) to every other ROI, from the perspective of a specific attention head. Higher values indicate stronger dependencies. This matrix is fundamental for capturing long-range interactions across the brain network.
- Why softmax? The softmax function normalizes the raw attention scores into a probability distribution. This ensures that the attention weights for any given query node sum to 1, making them directly interpretable as proportions of attention and stabilizing the learning process by providing bounded, positive values.
-
$W_Q^l$:
- Mathematical Definition: A learnable weight matrix used to linearly transform the input node features into "query" representations for the $l$-th layer.
- Physical/Logical Role: This matrix allows the model to learn what aspects of a node's features are important for querying other nodes. It projects the original features into a query space, enabling the model to "ask" specific questions about other nodes.
- Why multiplication? Matrix multiplication is the standard method for applying a linear transformation, which is a foundational operation in neural networks for projecting data into different feature spaces.
-
$X^{l-1}$:
- Mathematical Definition: The input node feature matrix for the $l$-th layer. For the first layer ($l=1$), $X^0$ is the functional connectivity (FC) matrix. In subsequent layers, it represents the refined node features from the previous layer.
- Physical/Logical Role: This matrix holds the current feature representations for all brain regions (ROIs). These features encode information about the functional activity and connectivity patterns of the brain, serving as the raw input for the Transformer's processing.
-
$W_K^l$:
- Mathematical Definition: A learnable weight matrix used to linearly transform the input node features into "key" representations for the $l$-th layer.
- Physical/Logical Role: Similar to $W_Q^l$, this matrix learns what aspects of a node's features are important for being queried by other nodes. It projects features into a key space, allowing nodes to "answer" queries.
- Why multiplication? Again, a linear transformation to create a distinct feature space for keys, enabling the attention mechanism to learn different facets of node relationships.
-
$(W_Q^l X^{l-1})^T (W_K^l X^{l-1})$:
- Mathematical Definition: This term computes the dot product between the Query matrix ($Q = W_Q^l X^{l-1}$) and the transpose of the Key matrix ($K = W_K^l X^{l-1}$). It results in a matrix of raw similarity scores between all query-key pairs.
- Physical/Logical Role: This is the core of the scaled dot-product attention. It measures the raw compatibility or alignment between each node's query and every other node's key. A higher dot product signifies greater relevance between a pair of nodes.
- Why dot product? The dot product is a computationally efficient way to quantify the similarity between two vectors. It captures how much they align in direction and magnitude, which is a good proxy for relevance in attention mechanisms.
-
$\sqrt{d_K^l}$:
- Mathematical Definition: The square root of the dimension of the key (and query) vectors.
- Physical/Logical Role: This term acts as a scaling factor. It divides the raw dot product scores to prevent them from becoming excessively large, especially when the feature dimensions are high. Large scores can lead to extremely sharp softmax distributions, resulting in vanishingly small gradients during training, which hinders learning.
- Why division? It's a common heuristic in Transformer models to stabilize training by normalizing the variance of the attention scores, ensuring that the softmax function operates in a more stable range.
-
$\odot$:
- Mathematical Definition: The element-wise product (Hadamard product) operator.
- Physical/Logical Role: This operator applies the enhanced structural connectivity mask to the scaled attention scores. It directly modulates the attention strength between pairs of nodes based on their structural connections.
- Why element-wise multiplication? This operation allows for a direct, multiplicative enhancement or suppression of individual attention scores. It's the natural way to apply a mask that scales the importance of each pairwise interaction. Addition would shift the scores, which is a different kind of modulation.
-
$(1 + M^{l-1})$:
- Mathematical Definition: The enhanced mask matrix $M^{l-1}$ (derived from structural connectivity features) with 1 added to each of its elements. $M^{l-1} \in \mathbb{R}^{N^{l-1} \times N^{l-1}}$.
- Physical/Logical Role: This term represents the crucial cross-modal integration of structural connectivity information into the attention mechanism. By adding 1, the authors ensure that even if there's no direct structural connection ($M^{l-1}_{ij}=0$), the attention score isn't completely zeroed out, allowing functional relationships to still be considered. However, existing structural connections (where $M^{l-1}_{ij} > 0$) will significantly enhance the attention between those ROIs, acting as a strong prior.
- Why addition of 1? This design choice ensures that structural connectivity acts as an enhancement rather than a strict binary filter. If $M^{l-1}$ were multiplied directly, any zero in the mask would completely block attention, which might be too restrictive. Adding 1 provides a baseline attention capacity while still amplifying attention along structurally supported pathways.
For the Cross-Modal Node Importance Score Equation: $\tilde{S}^l = \sigma(S^l \cdot W^l + b^l)$
-
$\tilde{S}^l$:
- Mathematical Definition: The final score vector representing the cross-modal importance of each node (ROI) at layer $l$. It's a column vector of size $N^{l-1} \times 1$.
- Physical/Logical Role: This vector quantifies how important each brain region is for the overall task of brain disease diagnosis, considering both its functional and structural characteristics. Nodes with higher scores are deemed more significant and are prioritized during the pooling process.
-
$\sigma$:
- Mathematical Definition: A non-linear activation function (e.g., sigmoid, ReLU). The paper doesn't specify, but it's a standard component of a Multi-Layer Perceptron (MLP).
- Physical/Logical Role: Introduces non-linearity into the importance scoring process. This allows the model to learn complex, non-linear relationships between the raw functional/structural importance features and the final combined cross-modal importance score. Without it, the MLP would only be able to learn linear combinations.
-
$S^l$:
- Mathematical Definition: A concatenated matrix of raw importance features from both structural ($s_s^l$) and functional ($s_f^l$) perspectives for each node. $S^l \in \mathbb{R}^{N^{l-1} \times 2}$.
- Physical/Logical Role: This matrix serves as the input to the single-layer MLP that learns the final cross-modal importance score. It brings together the initial, separate assessments of node importance from the two different modalities.
-
$W^l$:
- Mathematical Definition: A learnable weight matrix for the single-layer MLP at layer $l$. Given $S^l$ is $N^{l-1} \times 2$ and $\tilde{S}^l$ is $N^{l-1} \times 1$, $W^l$ must be of size $2 \times 1$.
- Physical/Logical Role: These are the parameters that the model learns to weigh the contributions of the functional and structural importance features. It effectively determines how to optimally combine the two modalities to derive a unified importance score.
- Why multiplication? Standard linear transformation within an MLP, mapping the 2-dimensional input features to a 1-dimensional output score.
-
$b^l$:
- Mathematical Definition: A learnable bias vector for the single-layer MLP at layer $l$. It's a column vector of size $N^{l-1} \times 1$.
- Physical/Logical Role: The bias term provides an additional degree of freedom for the MLP, allowing it to shift the output importance scores. This helps the model to better fit the data by adjusting the baseline activation level for each node.
- Why addition? Standard practice in neural networks, where a bias term is added after the weighted sum to allow for arbitrary shifts in the activation function's output.
Step-by-Step Flow
Let's trace how the features of a single abstract brain region, say ROI $j$, are processed through one layer of the Cross-Modal Brain Graph Transformer (CBGT). Imagine this as a sophisticated assembly line for brain data.
-
Initial Feature Input: Our journey begins with the feature vector $x_j^{l-1}$ for ROI $j$, which is part of the overall node feature matrix $X^{l-1}$ entering the $l$-th CBGT layer. If this is the very first layer, $X^0$ is the functional connectivity (FC) matrix.
-
Query, Key, and Value Projections (Parallel Paths):
- Query Path: $x_j^{l-1}$ is fed into a linear transformation defined by the learnable weight matrix $W_Q^l$. This generates a "query" vector, $q_j^{l,z}$, for each attention head $z$. This query is like a specific question ROI $j$ wants to ask about other ROIs.
- Key Path: Simultaneously, $x_j^{l-1}$ (and all other $x_i^{l-1}$) is transformed by $W_K^l$ to produce a "key" vector, $k_j^{l,z}$. These keys are like answers that ROIs can provide to queries.
- Value Path: In parallel, $x_j^{l-1}$ (and all other $x_i^{l-1}$) is also transformed by $W_V^l$ to create a "value" vector, $v_j^{l,z}$. These values contain the actual information to be aggregated.
-
Raw Attention Score Calculation: ROI $j$'s query vector $q_j^{l,z}$ is then compared with the key vectors $k_i^{l,z}$ of all other ROIs $i$ (including itself) using a dot product. This yields a raw compatibility score $q_j^{l,z} \cdot k_i^{l,z}$ for each pair $(j, i)$. This is done for all ROIs, forming a matrix of these raw scores.
-
Scaling for Stability: These raw attention scores are then divided by $\sqrt{d_K^l}$, a scaling factor based on the dimension of the key vectors. This step prevents the scores from becoming too large, which could destabilize the subsequent softmax operation.
-
Cross-Modal Structural Enhancement: Here's the critical cross-modal step for attention. The scaled attention scores are element-wise multiplied by $(1 + M^{l-1})$. The matrix $M^{l-1}$ contains structural connectivity information. If ROI $j$ and ROI $i$ have a strong structural connection (high $M^{l-1}_{ji}$), their attention score is significantly boosted. If there's no structural connection, the '+1' ensures a baseline attention is still possible, but it won't be amplified. This mechanism injects structural priors directly into the attention process.
-
Softmax Normalization: The enhanced and scaled scores are then passed through a softmax function. For each query ROI $j$, this normalizes its attention scores across all other ROIs $i$ such that they sum to 1. The output, $T^{l,z}_{ji}$, is now the normalized attention weight ROI $j$ places on ROI $i$ for head $z$.
-
Weighted Value Aggregation: The normalized attention weights $T^{l,z}_{ji}$ are used to compute a weighted sum of the value vectors $v_i^{l,z}$ from all ROIs $i$. For ROI $j$, its new representation for head $z$, denoted $h_j^{l,z}$, is the sum of $T^{l,z}_{ji} \cdot v_i^{l,z}$ over all $i$. This means ROI $j$'s updated feature is a blend of information from all other ROIs, weighted by how much attention it pays to them, guided by structural connectivity.
-
Multi-Head Combination: The outputs from all $Z$ attention heads ($h_j^{l,1}, h_j^{l,2}, \dots, h_j^{l,Z}$) are concatenated. This creates a richer, multi-faceted representation for ROI $j$. This concatenated vector is then linearly transformed by a final weight matrix $W^V$ to produce the output feature vector $x_j^l$ for ROI $j$ from the Transformer layer. This $x_j^l$ is now part of the updated node feature matrix $X^l$.
-
Node Importance Feature Generation (Pooling Prep): Now, for the pooling step, initial importance scores are derived for each ROI from both functional ($s_f^l$) and structural ($s_s^l$) perspectives. These two scores for ROI $j$ are concatenated to form a 2-dimensional feature vector, which is part of the $S^l$ matrix.
-
Cross-Modal Importance Scoring: The concatenated importance features $S^l$ are fed into a single-layer Multi-Layer Perceptron (MLP). This MLP, with its learnable weights $W^l$ and bias $b^l$, followed by a non-linear activation $\sigma$, learns to combine the functional and structural importance signals into a single, unified "cross-modal importance score" $\tilde{s}_j^l$ for ROI $j$. This score reflects the ROI's overall significance for disease diagnosis.
-
Top-K Selection: Based on these learned cross-modal importance scores $\tilde{S}^l$, the
topkfunction selects the $k$ ROIs with the highest scores. This yields an index vector $i$ identifying the most important ROIs. -
Pooled Graph Formation: The features of the selected top $k$ ROIs are extracted from $X^{l-1}$ (or $X^l$, depending on the exact implementation detail) and potentially scaled by a sigmoid of their importance scores. Simultaneously, the enhanced mask $M^{l-1}$ is reduced to only include the connections between these selected top $k$ ROIs, forming $M^l$. These new, reduced feature matrix $X_p^l$ and mask $M^l$ then become the input for the next CBGT layer, effectively reducing the graph size while preserving the most diagnostically relevant information.
As shown in Figure 1, the overall framework consists of three components: 1) Extraction of important structural connectivity features, where XGBoost is used to extract key structural connectivity features as the enhanced mask for the initial input to the cross-modal brain graph Transformer. 2) The cross-modal brain graph Transformer consists of multiple iterative layers, each including the cross-modal Transformer layer and the cross-modal topK pooling layer. 3) At the decision layer, a soft voting strategy integrates feature representations from each layer of the cross-modal brain graph Transformer to achieve a final decision.
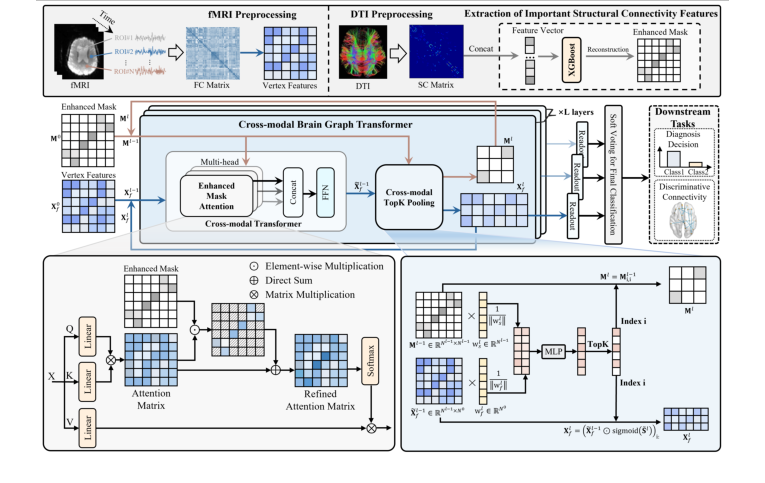 Figure 1. The proposed cross-modal brain graph Transformer framework
Optimization Dynamics
The Cross-Modal Brain Graph Transformer (CBGT) learns and refines its understanding of brain disease through a process of iterative optimization, primarily driven by gradient descent and a cross-entropy loss function.
-
Loss Landscape and Objective: The model's objective is to minimize the cross-entropy loss, which quantifies the difference between its predicted disease probabilities and the true labels. This loss function defines a complex, high-dimensional "loss landscape" where the model's parameters (all the $W$ and $b$ matrices) are points. The goal is to navigate this landscape to find the lowest points, representing optimal parameter configurations. The multi-head attention, non-linear activations, and the cross-modal interactions all contribute to the intricate shape of this landscape.
-
Adam Optimizer and Iterative Updates: The paper specifies the use of the Adam optimizer, a popular adaptive learning rate algorithm. During each training iteration (often called an epoch or step):
- Forward Pass: A batch of multi-modal brain graph data (fMRI for functional, DTI for structural) is fed through the entire CBGT architecture. This involves the initial structural feature extraction, multiple layers of cross-modal Transformer and topK pooling, and finally, the soft voting mechanism that aggregates predictions from all layers into a final classification probability $P(c)$.
- Loss Calculation: The cross-entropy loss is computed based on these predicted probabilities $P(c)$ and the known ground truth labels for the current batch.
- Backward Pass (Backpropagation): The calculated loss is then "backpropagated" through the network. This process efficiently computes the gradient of the loss with respect to every single learnable parameter in the model. A gradient indicates the direction and magnitude of change needed for each parameter to reduce the loss.
- Parameter Update: The Adam optimizer uses these gradients to update the model's weights and biases. Unlike simple stochastic gradient descent, Adam maintains per-parameter learning rates, adapting them based on the historical first (mean) and second (uncentered variance) moments of the gradients. This allows it to make larger updates for sparse gradients and smaller updates for dense ones, often leading to faster and more stable convergence.
-
Role of Cross-Modal Mechanisms in Optimization:
- Enhanced Attention: The structural connectivity mask $(1 + M^{l-1})$ plays a crucial role in shaping the gradients. By explicitly enhancing attention along structurally connected pathways, it acts as a strong inductive bias. This means the model is encouraged to learn functional dependencies that are supported by underlying physical connections. This guidance can regularize the attention mechanism, preventing it from focusing on spurious correlations and potentially leading to a smoother, more meaningful loss landscape in regions relevant to brain connectivity. The gradients flowing back through this enhancement term will push the model to refine its attention based on this structural prior.
- Cross-Modal TopK Pooling: The learned node importance scores $\tilde{S}^l$ are central to efficient optimization. The MLP responsible for generating $\tilde{S}^l$ learns to identify the most diagnostically relevant ROIs by integrating both functional and structural cues. Gradients flowing back through this pooling layer will update the weights ($W^l$) and biases ($b^l$) of this MLP, improving its ability to accurately score node importance. By pruning less important nodes, the pooling layer effectively reduces the dimensionality of the graph for subsequent layers. This not only reduces computational cost but also focuses the model's learning capacity on the most salient features, potentially accelerating convergence and preventing the model from overfitting to noise in irrelevant regions.
-
Convergence and Robustness: The iterative process continues until the model's performance on a separate validation set stops improving, or a predefined number of epochs is reached. The use of a fixed initial learning rate (1e-4) and the adaptive nature of Adam help the model navigate the complex loss landscape. The ablation studies in the paper provide strong evidence that the cross-modal components are not just architectural novelties but are vital for achieving superior diagnostic accuracy. This suggests they help the model find better, more robust optima in the loss landscape, leading to a more effective and interpretable solution for brain disease diagnosis. The soft voting strategy further contributes to the robustness of the final decision by averaging predictions across different layers, smoothing out potential errors from individual layers.
Results, Limitations & Conclusion
Experimental Design & Baselines
The authors meticulously designed their experiements to validate the Cross-Modal Brain Graph Transformer (CBGT) on two widely recognized public datasets for brain disease diagnosis: the Alzheimer's Disease Neuroimaging Initiative (ADNI) and the Autism Brain Imaging Data Exchange (ABIDE). For ADNI, a subset of 330 cases was utilized, comprising 66 Alzheimer's Disease (AD) patients, 125 individuals with mild cognitive impairment (MCI), and 139 normal controls (NCs). The ABIDE dataset included 95 subjects, split into 53 Autism Spectrum Disorder (ASD) patients and 42 normal controls. All brain imaging data (fMRI and DTI) were preprocessed using standard pipelines (DPARSF for fMRI, PANDA for DTI) and parcellated into 90 regions of interest (ROIs) based on the AAL atlas.
The CBGT model was implemented in PyTorch and trained on an NVIDIA 3090 GPU, employing the Adam optimizer with an initial learning rate of $1 \times 10^{-4}$. Key hyperparameters, such as the structural feature selection threshold $p$ (set to 3) and the number of CBGT layers $L$ (set to 2), were determined through grid search. A robust five-fold cross-validation strategy was applied to ensure the generalizability of the results.
To rigorously demonstrate the superiority of their cross-modal approach, the authors pitted CBGT against a comprehensive suite of "victim" baseline models. These baselines represented various state-of-the-art methods, categorized by the type of connectivity data they utilized:
- fMRI-only methods: BrainGNN, BrainIB, BrainNetTF, and ALTER. These models primarily rely on functional connectivity to capture brain activity patterns.
- DTI-only methods: SVM and GAT. These focus on structural connectivity, representing physical fiber connections.
- Cross-modal methods: BrainNN, MME-GCN, and Cross-GNN. These baselines also attempt to integrate information from both fMRI and DTI, providing a direct comparison for the CBGT's fusion strategy.
Performance was evaluated using four standard metrics: accuracy, sensitivity, specificity, and Area Under the Curve (AUC), ensuring a holistic assessment of diagnostic capability.
What the Evidence Proves
The evidence presented in this paper strongly supports the core mathematical claims of the CBGT method: its ability to effectively leverage complementary information from functional and structural connectivity networks, capture long-range dependencies, and preserve essential graph information through cross-modal topK pooling.
The definitive, undeniable evidence comes from the comparative experiments (Table 1) and the ablation study (Table 2). Across all classification tasks on both ADNI and ABIDE datasets, CBGT consistently achieved the highest accuracy, sensitivity, specificity, and AUC scores, ruthlessly defeating all baseline models. For instance, in the ADNI (AD vs. NC) classification, CBGT achieved an accuracy of 81.5%, significantly outperforming the next best cross-modal method, Cross-GNN, which scored 78.5%. Similarly, for the MCI vs. NC task, CBGT's accuracy of 74.3% represented an improvement of over 3.9% compared to other cross-modal methods, such as BrainNN (65.0%) or MME-GCN (69.6%). The ABIDE (ASD vs. NC) task also saw CBGT leading with 70.5% accuracy, surpassing Cross-GNN's 66.6%. These consistent gains across diverse tasks underscore the effectiveness of the proposed architecture.
The ablation study provided crucial insights into the individual contributions of CBGT's core mechanisms. It demonstrated that using a vanilla unimodal Transformer resulted in a substantial 4.9% decrease in accuracy for the AD vs. NC classification task compared to the full cross-modal Transformer. This directly proves that the integration of structural information to enhance the attention mechanism is vital for capturing long-range dependencies in cross-modal brain networks. Furthermore, ablating the cross-modal topK pooling or replacing it with unimodal pooling led to a noticeable performance decline. This unequivocally shows that the cross-modal topK pooling, by considering both functional and structural connectivity information, is sucessfully identifying and retaining ROIs critical for disease prediction, thereby preserving more effective graph information during dimensionality reduction.
Beyond quantitative metrics, the interpretation analysis (Section 3.5 and Fig. 2) provided compelling qualitative evidence. The discriminative ROIs and connectivity identified by CBGT were found to be highly consistent with findings from previous medical studies. For example, the model highlighted the superior frontal gyrus (SFGmed, ORBsup) and parahippocampal gyrus (PHG) for AD vs. NC, and the precuneus (PCUN) and rectus (REC) for ASD vs. NC. These regions are known to be implicated in the respective diseases, providing strong biological plausibility and confirming that the model learns clinically meaningful multi-modal biomarkerss. This interpretability serves as undeniable evidence that the core mechanism not only works statistically but also aligns with real-world neuroscientific understanding.
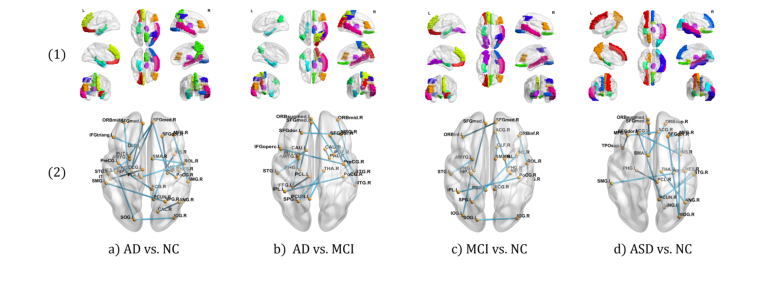 Figure 2. Visualization of discriminative ROIs and connectivity
Limitations & Future Directions
While the Cross-Modal Brain Graph Transformer (CBGT) demonstrates impressive performance and offers valuable interpretability, the paper, like any scientific endeavor, has inherent limitations that open avenues for future research. One notable aspect is that the paper does not explicitly detail limitations of its own method, but rather highlights how CBGT overcomes shortcomings of previous approaches. This implies that the current CBGT, while advanced, might still face challenges not yet explored.
Here are some discussion topics for further development and evolution of these findings:
- Generalizability to Other Diseases and Data Modalities: CBGT has been validated on AD and ASD. How robust is its performance when applied to other neurological or psychiatric disorders (e.g., Parkinson's, schizophrenia, depression)? Could the framework be extended to integrate additional modalities like genetic data, clinical scores, or electrophysiological signals (EEG/MEG) to provide an even richer, more holistic view of brain pathology?
- Dynamic Connectivity and Longitudinal Studies: The current approach primarily focuses on static functional and structural connectivity. Brain diseases, however, are often progressive. Future work could explore incorporating dynamic functional connectivity (how connections change over time) or longitudinal data to model disease progression and predict future states, potentially identifying early biomarkers.
- Advanced Feature Extraction and Fusion: The paper uses XGBoost for initial structural feature extraction. While effective, this is a separate, pre-processing step. Could an end-to-end deep learning approach be developed where structural feature extraction is learned jointly with the Transformer, potentially leading to more optimized and context-aware feature representations? Furthermore, exploring more sophisticated cross-modal fusion techniques beyond enhanced attention and topK pooling, such as co-attention mechanisms or tensor-based fusion, could yield further improvements.
- Adaptive Graph Pooling and Hierarchical Structures: The cross-modal topK pooling is a fixed-ratio pooling strategy. Investigating adaptive pooling methods that dynamically determine the number of ROIs to retain based on disease severity or individual brain characteristics could be beneficial. Additionally, exploring hierarchical graph structures that capture brain organization at multiple scales (e.g., sub-regions, lobes, hemispheres) might provide a more nuanced understanding of disease impact.
- Robustness to Data Scarcity and Imbalance: Medical imaging datasets are often small and imbalanced, especially for rare diseases. How robust is CBGT to limited data? Future research could explore techniques like few-shot learning, transfer learning from larger, related datasets, or advanced data augmentation strategies to enhance the model's performance and reliability in data-scarce scenarios.
- Enhanced Interpretability and Clinical Translation: While CBGT identifies discriminative ROIs, further enhancing interpretability could provide deeper clinical insights. This might involve developing methods to pinpoint specific fiber tracts or functional pathways most affected, or quantifying the contribution of individual connections to the diagnostic decision. Collaborating with clinicians to validate these fine-grained biomarkers and translate them into practical diagnostic tools or treatment targets would be a crucial next step.
- Computational Efficiency and Scalability: Transformers can be computationally intensive, especially with increasing graph sizes or deeper architectures. Investigating methods to improve the computational efficiency of CBGT, such as sparse attention mechanisms or knowledge distillation, would be important for deploying such models in real-world clinical settings with potentially larger parcellations or higher-resolution data.
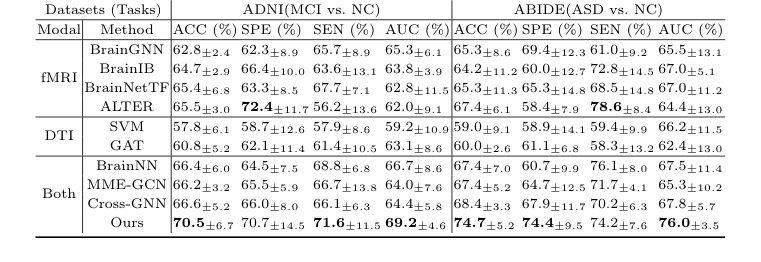 Table 2. Ablation Study Results on Different Datasets
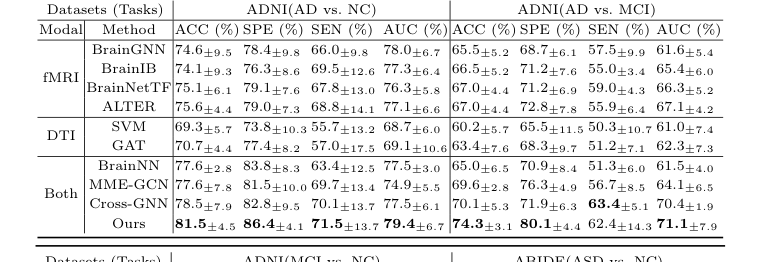 Table 1. Comparative Experiments of Classification Tasks on Different Datasets
Connections to Other Fields
Mathematical Skeleton
The pure mathematical core of this work lies in adapting the Transformer's self-attention mechanism for graph-structured data, specifically by incorporating an external, cross-modal "enhanced mask" to modualte attention scores. Furthermore, it introduces a graph pooling strategy that selects top-k nodes based on a learned importance score derived from multi-modal features.
Adjacent Research Areas
Graph Transformers and Graph Neural Networks
The proposed Cross-modal Brain Graph Transformer (CBGT) is fundamentally rooted in the field of Graph Neural Networks (GNNs) and, more specifically, Graph Transformers. The paper's attention mechanism, as described in equations (3), (4), and (5), directly extends the self-attention concept from standard Transformers to graph data. The key technical connection is the integration of the "enhanced mask" $M^{l-1}$ (derived from structural connectivity) into the attention score computation (specifically, the term $(1 + M^{l-1})$ in equation (4)). This represents a novel way to inject cross-modal information to guide the attention mechnisms within a graph Transformer layer. This approach builds upon and contributes to the broader research on applying attention-based models to graph-structured data for complex relational learning.
Veličković, P., Cucurull, G., Casanova, A., Romero, A., Lio, P., Bengio, Y.: Graph attention networks. arXiv preprint arXiv:1710.10903 (2017)
Multi-modal Data Fusion
This work makes a clear technical connection to the field of multi-modal data fusion, particularly in how it integrates information from functional and structural brain connectivity networks. Instead of simple concatenation or late fusion, the paper employs an interactive fusion strategy at two critical points: modulating the attention mechanism and informing the graph pooling process. The "enhanced mask" from structural connectivity directly influences the attention scores of the functional connectivity graph, and the cross-modal topK pooling (equations (6), (7), (8)) explicitly computes node importance by combining structural and functional perspectives. This fine-grained, interactive fusion contrasts with many methods that perform fusion only at the feature level or decision level, offering a more deeply integrated approach to leveraging complementary data.
Baltrušaitis, T., Ahuja, C., Morency, L.P.: Multimodal machine learning: A survey and taxonomy. IEEE Transactions on Pattern Analysis and Machine Intelligence 41(2), 421-443 (2019)
Graph Pooling Methods
The "cross-modal topK pooling module" presented in this paper establishes a direct link to research on graph pooling methods. Graph pooling is a crucial component in hierarchical graph neural networks, enabling the reduction of graph size while preserving salient information. The paper's contribution, outlined in equations (6), (7), and (8), is a pooling strategy where the node importance score $S^l$ is learned by integrating features from both functional and structural connectivity networks. This makes it a cross-modal, learned pooling mechanism, distinct from unimodal or purely structural pooling techniques. It addresses the challenge of selecting the most informative nodes in a multi-modal graph context, which is a key problem in learning efficient graph representations. This is a semina contribution to the design of more sophisticated pooling layers for complex graph data.
Ying, R., You, J., Morris, C., Ren, X., Hamilton, W., Leskovec, J.: Hierarchical graph representation learning with differentiable pooling. Advances in Neural Information Processing Systems 31 (2018)