Seeing Beyond the Surface: Retinal Thickness Prediction from Color Fundus Photography for DME Management
New model turns basic eye scans into detailed maps, boosting DME diagnosis in low-resource areas.
Background & Academic Lineage
The Origin & Academic Lineage
The problem addressed in this paper, predicting Retinal Thickness Maps (RTMs) solely from Color Fundus Photography (C-FP) for Diabetic Macular Edema (DME) management, arises from a critical need for accessible and cost-effective diagnostic tools in ophthalmology. Diabetic macular edema is a leading cause of severe vision loss, particularly in the working-age population, imposing a substantial global healthcare burden.
Historically, Optical Coherence Tomography (OCT) has been the gold standard for assessing DME, as it provides detailed RTMs that quantify retinal pathologies with high accuracy. However, OCT devices are expensive and complex to operate, severely limiting their accessibility, especially in resource-constrained settings or for routine home monitoring. This accessibility gap often leads to insufficient follow-up visits and suboptimal treatment outcomes for patients undergoing therapies like anti-Vascular Endothelial Growth Factor (anti-VEGF).
Previous attempts to leverage C-FP, a widely available and cost-effective 2D imaging technique (even feasible with smartphones), faced significant limitations. Early approaches relied on surrogate markers of retinal thickening, such as lipid deposits, which lacked the necessary depth resolution and resulted in limited specificity and sensitivity for DME detection. For instance, prior models attempting to predict retinal thickening from C-FP often failed to meet clinical standards, particularly with lower image quality. More recent efforts tried to bridge this gap by using Infrared Fundus Photography (IR-FP) as an intermediary to extract thickness information. While IR-FP is used as a localizer for OCT acquisition in clinical practice, it still requires an additional device, limiting its widespread application. Furthermore, IR-FP itself has inherent drawbacks, including hyperreflective artifacts, a restricted illumination wavelength optimized for subretinal structures, and inadequate visualization of critical pathological markers like hard exudates and hemorrhages.
The fundamental "pain point" that forced the authors to write this paper is the inability of existing methods to provide a comprehensive, accurate, and accessible solution for retinal thickness assessment. OCT is too costly and complex for widespread use, while previous C-FP and IR-FP based methods were either inaccurate, lacked depth information, or still required specialized equipment. This paper aims to overcome these limitations by proposing the first approach to predict RTMs solely from C-FP, thereby transforming conventional fundus imaging into a comprehensive and cost-effective diagnostic tool for DME screening and monitoring, particularly in resource-limited environments. This novel approch promises to improve patient outcomes through more timely and effective interventions.
Intuitive Domain Terms
Here are a few specialized terms from the paper, explained with everyday analogies for a zero-base reader:
- Diabetic Macular Edema (DME): Imagine a small, vital area in the center of your eye's "camera sensor" (the macula) that becomes swollen and blurry because of diabetes. It's like a tiny puddle forming on the lens of a camera, making everything fuzzy.
- Optical Coherence Tomography (OCT): Think of this as a super-advanced sonar for your eye. Instead of sound waves, it uses light waves to create incredibly detailed cross-sectional pictures of your retina, showing its internal layers and thickness, much like cutting a cake to see all its layers.
- Retinal Thickness Map (RTM): This is the output from the OCT scan, a colorful "heat map" of your retina. Areas that are thicker than normal might be colored red or yellow, while thinner areas are blue, giving doctors a quick visual guide to problem spots, like a weather map showing temperature variations.
- Color Fundus Photography (C-FP): This is simply a standard, flat, 2D photograph of the back of your eye, showing the surface features like blood vessels and the optic nerve. It's like taking a regular picture of a landscape; you see the trees and mountains, but you don't get a sense of their height or depth.
- Diffusion Model: This is a type of artificial intelligence that learns to create complex images by starting with pure random noise and gradually "denoising" it step-by-step until it forms a clear, desired image. It's akin to a sculptor starting with a shapeless block of marble and slowly, iteratively carving away until a detailed statue emerges.
Notation Table
| Notation | Description
Problem Definition & Constraints
Core Problem Formulation & The Dilemma
The core problem addressed by this paper is to accurately predict Retinal Thickness Maps (RTMs) solely from Color Fundus Photography (C-FP).
Input/Current State:
The current gold standard for managing Diabetic Macular Edema (DME) and assessing retinal thickness involves Optical Coherence Tomography (OCT). OCT provides detailed RTMs, which are quantitative visualizations of retinal structures and pathologies. In contrast, Color Fundus Photography (C-FP) is a widely available, cost-effective, and easily accessible 2D imaging technique, even feasible with smartphones. However, C-FP traditionally lacks the depth information necessary for quantitative retinal thickness evaluation.
Desired Endpoint/Goal State:
The paper aims to develop a system that can generate precise and comprehensive RTMs directly from C-FP. The ultimate goal is for these C-FP-derived RTMs to serve as an efficient, accessible, and cost-effective diagnostic and monitoring tool for DME, particularly in resource-limited settings. This would facilitate timely intervention, informed treatment decisions, and improved patient visual outcomes, effectively transforming conventional fundus imaging into a powerful diagnostic asset.
Missing Link or Mathematical Gap:
The fundamental missing link is the inherent lack of depth resolution in 2D C-FP images. RTMs represent 3D thickness information, while C-FP only captures a 2D projection. Previous attempts to bridge this gap by predicting thickness from C-FP often relied on surrogate markers (like lipid deposits) with limited specificity and sensitivity, or models that simply couldn't achieve the necessary clinical accuracy, especially with varying image quality. The mathematical challenge is to infer a continuous, quantitative 3D thickness distribution from a 2D image where depth information is implicitly encoded in subtle visual cues rather than explicit measurements.
Painful Trade-off or Dilemma:
The central dilemma is the trade-off between accessibility/cost-effectiveness and quantitative accuracy/detail. OCT provides high-fidelity RTMs but is expensive, complex to operate, and has limited accessibility, leading to suboptimal patient follow-up in many real-world scenarios. C-FP is highly accessible and inexpensive, but its 2D nature has historically prevented it from providing the precise quantitative thickness measurements required for detailed DME management. Researchers have been trapped trying to extract sufficient quantitative information from C-FP without losing its inherent advantages of accessibility and low cost, or without introducing new limitations by relying on intermediate, less accessible modalities like IR-FP. This paper directly confronts this dilemma by attempting to achieve OCT-level RTM prediction solely from C-FP.
Constraints & Failure Modes
This problem is insanely difficult due to several harsh, realistic constraints:
- Inherent 2D Nature of C-FP: As mentioned, C-FP provides no direct depth information. Inferring 3D retinal thickness from a 2D image is an ill-posed inverse problem, requiring the model to learn complex, non-obvious relationships between surface features and underlying thickness.
- Subtle Pathological Biomarkers: DME-induced retinal layer disorganization manifests as "subtle texture and color variations" in C-FP. These subtle cues are challenging to identify even for experienced clinicians, let alone for an automated system. The model must be able to detect these minute changes to accurately predict thickness.
- Spatial Misalignment and Registration Challenges: Achieving precise pixel-wise spatial correspondence between C-FP (the input) and the RTM ground truth (derived from OCT, often localized by IR-FP) is a significant hurdle. Different imaging modalities have varying fields of view, resolutions, and potential distortions, making accurate multi-modal registration a complex pre-processing step. The paper notes the use of IR-FP as an intermediary for registration, highlighting this difficulty.
- Heterogeneity of DME Manifestations: DME presents with a wide range of pathological lesions and irregular retinal anatomy. A robust model must generalize across these diverse manifestations, which requires capturing both global contextual features (like vascular networks) and fine-grained local details (macular region changes).
- Computational Demands for High-Fidelity Generation: Generating high-resolution, accurate RTMs using advanced generative models like diffusion models can be computationally intensive, particularly during the inference (sampling) phase. The need to "expedite sampling while maintaining high fidelity" (as addressed by DDIM) underscores this computational constraint.
- Strict Clinical Accuracy Requirements: Previous C-FP-based prediction models "failed to meet clinical standards." This sets a high bar for the required accuracy, specificity, and sensitivity of any new solution to be clinically viable. The model's predictions must be reliable enough to inform critical medical decisions.
- Data Availability and Annotation Quality: Training such a model requires large datasets of precisely paired C-FP, IR-FP, and OCT images, with expert annotations for RTMs and DME diagnosis. Acquiring and curating such high-quality, multi-modal datasets is a time-consuming and resource-intensive process.
- Peripheral Context Loss vs. Macular Detail: While the macular region is critical for thickness evaluation, important global retinal structures and pathological biomarkers (e.g., optic nerve head, vascular networks) are present in the wider fundus image. Focusing only on the macula risks losing this crucial "peripheral context," necessitating a dual-stream approach to integrate both global and local features.
Why This Approach
The Inevitability of the Choice
The authors found themselves in a situation where traditional "SOTA" (State-of-the-Art) methods, including standard CNNs, basic diffusion models, or Transformers, were simply not cutting it for the specific, nuanced problem of predicting Retinal Thickness Maps (RTMs) directly from Color Fundus Photography (C-FP). The core realization stemmed from a critical clinical need: while Optical Coherence Tomography (OCT) is the gold standard for diagnosing and managing Diabetic Macular Edema (DME), its high cost and limited accessibility in resource-constrained settings make it impractical for widespread screening and frequent monitoring. This created an urgent demand for a more accessible alternative.
Color Fundus Photography (C-FP) emerged as the most viable, cost-effective screening tool, being widely available and even feasible with smartphones. However, C-FP presents a fundamental challenge: it's a 2D imaging technique, inherently lacking the depth resolution required for quantitative retinal layer evaluation. Previous attempts to predict retinal thickness from C-FP relied on surrogate markers like lipid deposits, which showed limited specificity and sensitivity. Even more advanced deep learning models, such as the one by Arcadu et al. [3], failed to meet clinical standards for prediction accuracy, especially with poor image quality.
The authors also considered Infrared Fundus Photography (IR-FP) as an intermediary, which some SOTA methods like DeepRT [15] and M²FRT [26] used. However, IR-FP still requires an additional device, limiting its clinical application. Moreover, IR-FP itself has inherent limitations, such as hyperreflective artifacts and inadequate visualization of critcal pathological markers like hemorrhages. C-FP, in contrast, offers superior spatial resolution, a broader spectral range, and a wider field of view. It captures critical global retinal structures, such as vascular networks and optic nerve heads, which are key pathological biomarkers. The exact moment of realization that a novel approach was needed likely occurred when it became clear that existing methods either couldn't handle the 2D-to-3D inference accurately enough, or they relied on imaging modalities that didn't meet the accessibility and cost-effectiveness requirements. The subtle texture and color variations in C-FP, indicative of DME-induced retinal layer disorganization, demanded a model capable of extracting both robust high-level semantic features and precise local macular details, a capability that standard SOTA methods struggled to achieve simultaneously and with sufficient fidelity.
Comparative Superiority
The Global-to-Local conditional Diffusion model for Retinal Thickness prediction (GLD-RT) demonstrates overwhelming qualitative superiority beyond mere performance metrics. Its structural advantage lies in its unique dual-stream, hybrid CNN-transformer conditional diffusion architecture, which is specifically designed to address the inherent complexities of C-FP data for RTM generation.
Firstly, GLD-RT's ability to integrate both global contextual features and fine-grained local details is a significant structural advantage. The global full-fundus encoder ($E_g$), leveraging a pre-trained RETFound model, captures robust anatomical and pathological patterns from the entire C-FP image. Simultaneously, the local macular encoder ($E_m$), built with a Swin-Transformer, extracts intricate, fine-grained features from the macular region. This dual-stream approach ensures that the model doesn't miss the broader context while also focusing on the subtle, yet clinically important, local variations in the macula, which are often indicative of DME. This is crucial becuase DME affects both large-scale vessel characteristics and minute retinal layer integrity.
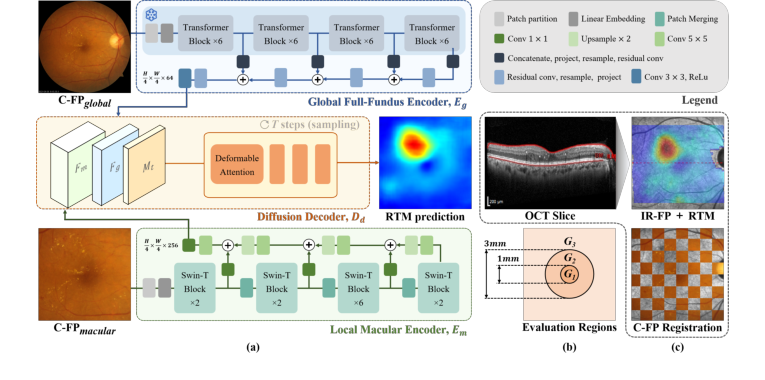 Figure 1. (a) GLD-RT leverages a dual-stream diffusion framework to integrate global contextual features with fine-grained details. (b) Evaluation regions for RTM predic- tion. (c)IR-FP, the localizer in OCT imaging that generates RTM, is used to register C-FPglobal with RTM, generating C-FPmacular
Secondly, the use of a conditional diffusion decoder is qualitatively superior for this generative task. Unlike traditional discriminative models or even simpler generative adversarial networks (GANs), diffusion models excel at generating high-fidelity, diverse, and anatomically consistent outputs by progressively denoising a noisy input. This is particularly advantageous for RTM prediction, where the output is a complex, continuous thickness map that must accurately reflect both physiological and pathological morphology. The diffusion process, guided by the rich global and local features, allows for a more nuanced and accurate depiction of subtle and irregular retinal anatomy, especially in the challenging central macula (G1 region), as evidenced by the qualitative results in Fig. 2 and the ablation study. The adoption of the Denoising Diffusion Implicit Model (DDIM) also allows for significantly fewer sampling steps, improving practical efficiency without sacrificing fidelity.
This structural design enables GLD-RT to handle the high-dimensional noise and variability inherent in C-FP images better than previous methods. It doesn't just predict a map; it generates a plausible, detailed RTM that aligns with the complex underlying retinal structure, a task where simpler models often fall short in maintaining anatomical consistency and fine detail.
Alignment with Constraints
The chosen GLD-RT method perfectly aligns with the harsh requirements of the problem, forming a "marriage" between clinical necessity and innovative solution design.
-
Constraint: Limited OCT accessibility and high cost.
- Alignment: GLD-RT is the first model to predict RTMs solely from C-FP. C-FP is widely available, cost-effective, and can even be captured with smartphones. This directly addresses the need for an accessible and affordable diagnostic tool, transforming conventional fundus imaging into a comprehensive screening and monitoring solution for resource-limited settings.
-
Constraint: C-FP's 2D nature lacks depth resolution for quantitative evaluation.
- Alignment: The conditional diffusion model is inherently a generative model capable of synthesizing complex, high-dimensional outputs from conditional inputs. By learning the intricate mapping from 2D C-FP features to 3D retinal thickness distributions, GLD-RT effectively infers depth information that is not explicitly present in the input image. This generative capability is key to overcoming the 2D limitation.
-
Constraint: Need for accurate, detailed, and clinically relevant RTMs.
- Alignment: The dual-stream architecture (global-to-local encoders) ensures that both broad anatomical context and fine-grained macular details are captured. The global encoder (RETFound) provides robust high-level semantic features, while the local encoder (Swin-Transformer) extracts precise local details. These are then fused and fed into a hierarchical diffusion decoder that ensures "global-to-local anatomical consistency." This design is crucial for accurately depicting both physiological and pathological retinal morphology, which is paramount for clinical utility and detailed examination of retinal structures. The ablation study confirms that the diffusion process sucessfully captures macular structure with fine details, particularly in the complex central macula (G1).
-
Constraint: Practicality for resource-constrained settings (efficiency).
- Alignment: While diffusion models can be computationally intensive, the use of the DDIM for sampling significantly reduces the number of steps required for inference, making the process more efficient and practical for real-world clinical application. The overall goal is to provide an "efficient diagnostic tool for timely intervention."
Rejection of Alternatives
The paper implicitly and explicitly rejects several alternative approaches by highlighting their limitations in the context of RTM prediction from C-FP.
Firstly, traditional methods relying on surrogate markers (e.g., lipid deposits, laser scars) were deemed insufficient. The authors state that these approaches demonstrated "limited specificity and sensitivity for DME detection" [28, 29]. This is a clear rejection of non-machine learning or simpler rule-based methods that cannot capture the complex, subtle manifestations of DME.
Secondly, earlier deep learning models for C-FP-based RTM prediction were found wanting. The paper mentions that a model by Arcadu et al. [3] "failed to meet clinical standards" for prediction accuracy, especially with poor image quality. This suggests that simpler CNN-based architectures or less sophisticated generative models (which were common at the time) could not extract the necessary information from C-FP to produce clinically acceptable RTMs. They likely struggled with the 2D-to-3D inference and the subtle variations in C-FP that indicate DME.
Thirdly, methods relying on Infrared Fundus Photography (IR-FP), such as DeepRT [15] and M²FRT [26], were rejected as the sole viable solution due to practical and inherent imaging limitations. While these methods showed improvements, they still required an "additional device to capture IR-FP," which limits their clinical application in resource-constrained settings. Furthermore, IR-FP itself suffers from "hyperreflective artifacts, restricted illumination wavelength optimized for subretinal structures, and inadequate visualization of critical pathological markers" [1]. This makes C-FP a more desirable input, despite its challenges.
Finally, the paper's ablation study provides strong evidence for the rejection of simpler decoding mechanisms and the necessity of the diffusion process. The results show that the proposed diffusion decoder ($D_d$) "remarkably improved model performance, particularly in the central macula (G1)" compared to a decoder without diffusion ($D_{nd}$). This implies that standard decoding approaches, which might be used in non-diffusion generative models or direct regression models, were insufficient for capturing the fine structural details and anatomical consistency required in this complex region. The statement that "Global-to-local feature conditioning outperformed standard decoding approaches" further reinforces that simpler, non-hierarchical or non-conditional generative frameworks would have been less effective in leveraging the rich, multi-scale information from C-FP. While not explicitly naming GANs, the emphasis on high-fidelity generation, anatomical consistency, and the ability to capture subtle details strongly suggests that diffusion models were chosen over other generative paradigms due to their superior performance in these aspects for medical image synthesis.
Mathematical & Logical Mechanism
The Master Equation
The absolute core of the GLD-RT framework's learning mechanism is its optimization objective, which is a Mean Squared Error (MSE) loss function. This equation guides the model in learning to predict Retinal Thickness Maps (RTMs) accurately from Color Fundus Photography (C-FP) by minimizing the difference between its predictions and the ground truth.
The master equation is presented as:
$$ \mathcal{L} = \mathbb{E}_{M,t,F_m,F_g} [||M – D_d(M_t, t, F_m, F_g) ||^2] $$
Term-by-Term Autopsy
Let's dissect this equation to understand the role of each component:
-
$\mathcal{L}$:
- Mathematical Definition: This symbol represents the overall loss function, specifically the Mean Squared Error (MSE) loss.
- Physical/Logical Role: It quantifies the discrepancy between the model's predicted RTM and the actual ground truth RTM. The primary objective during the model's training is to minimize this value, thereby driving the model to make more accurate predictions.
- Why used: MSE is a standard and effective loss function for regression tasks. Its squaring operation penalizes larger errors more significantly than smaller ones, encouraging the model to reduce substantial deviations.
-
$\mathbb{E}_{M,t,F_m,F_g}$:
- Mathematical Definition: This denotes the expectation operator, signifying an average over the random variables $M$, $t$, $F_m$, and $F_g$.
- Physical/Logical Role: In practice, during training, this expectation is approximated by averaging the squared differences over a batch of training samples. Each sample comprises a ground truth RTM ($M$), a specific noise timestep ($t$), local macular features ($F_m$), and global full-fundus features ($F_g$). This averaging ensures that the model learns to generalize well across a diverse range of inputs and noise conditions.
- Why used: Averaging the loss over a batch of samples provides a more stable and representative gradient for updating the model's parameters compared to calculating the loss for a single sample, which can be noisy.
-
$M$:
- Mathematical Definition: This represents the ground truth Retinal Thickness Map (RTM). It is a 2D matrix of real values, typically with dimensions $H \times W$, where $H$ and $W$ are the height and width of the map.
- Physical/Logical Role: This is the "correct answer" or target output that the GLD-RT model aims to predict. It serves as the reference against which the model's predictions are compared.
- Why used: It is the essential benchmark for calculating the error and evaluating the model's performance.
-
$D_d(\cdot)$:
- Mathematical Definition: This represents the diffusion decoder, which is a complex neural network. It takes a noisy RTM, a timestep, and conditional features as input, and its goal is to predict the original, un-noisy RTM.
- Physical/Logical Role: This is the generative engine of the model. During training, it learns to "denoise" a corrupted RTM back to its original state, guided by the extracted C-FP features. During inference, it iteratively transforms pure noise into a predicted RTM, again using the C-FP features as guidence.
- Why used: The diffusion model framework is chosen for its proven capability in generating high-fidelity images and modeling complex data distributions, which is critical for the intricate details of RTMs. The conditional aspect allows the generation process to be steered by the input C-FP features.
-
$M_t$:
- Mathematical Definition: This is a noisy version of the ground truth RTM, $M$, at a specific diffusion timestep $t$. It is created by adding scheduled Gaussian noise to $M$.
- Physical/Logical Role: This serves as the input to the diffusion decoder during training. The decoder's task is to learn how to effectively remove the noise from $M_t$ to reconstruct the original $M$. This process mimics the reversal of a forward diffusion process where noise is progressively introduced.
- Why used: Diffusion models operate by learning to reverse a predefined forward process of noise addition. By training the model on $M_t$ at various timesteps, it develops the ability to denoise across a wide spectrum of noise levels.
-
$t$:
- Mathematical Definition: This is the diffusion timestep, an integer value that indicates the amount of noise added to $M$ to produce $M_t$. It typically ranges from a small value (minimal noise) to a large value (maximal noise).
- Physical/Logical Role: It provides crucial information to the diffusion decoder about the current noise level present in $M_t$. Knowing $t$ allows the decoder to apply the appropriate denoising operation for that specific noise intensity.
- Why used: The timestep is fundamental for diffusion models, as the denoising strategy is highly dependant on the quantity of noise. Different timesteps necessitate distinct denoising approaches.
-
$F_m$:
- Mathematical Definition: These are the fine-grained local macular features extracted by the Local Macular Encoder ($E_m$) from the cropped macular region of the C-FP image ($C\text{-}FP_{macular}$). These features have dimensions $R^{\frac{H}{4} \times \frac{W}{4} \times 256}$.
- Physical/Logical Role: These features provide highly detailed information about the macular region, which is essential for precise thickness prediction in this clinically critical area. They act as a local condition, guiding the diffusion process with fine-grained anatomical context.
- Why used: The macular region is where Diabetic Macular Edema (DME) pathologies are most evident and require meticulous analysis. The $E_m$ encoder, utilizing a Swin-Transformer and Feature Pyramid Network, is designed to capture these hierarchical and detailed features.
-
$F_g$:
- Mathematical Definition: These are the global full-fundus features extracted by the Global Full-Fundus Encoder ($E_g$) from the entire C-FP image ($C\text{-}FP_{global}$). These features have dimensions $R^{\frac{H}{16} \times \frac{W}{16} \times 64}$.
- Physical/Logical Role: These features provide high-level semantic context and information about the overall retinal structure. They compensate for any peripheral context lost when focusing solely on the macular region, acting as a global condition for the diffusion process.
- Why used: Global context helps ensure anatomical consistency across the entire retina and provides broader pathological markers (such as vascular networks) that can influence macular thickness. The $E_g$ encoder leverages a pre-trained RETFound Vision Transformer for this purpose.
-
$|| \cdot ||^2$:
- Mathematical Definition: This denotes the squared L2 norm, which calculates the sum of the squares of all elements in a vector or matrix. For a matrix $A$, $||A||^2 = \sum_{i,j} A_{i,j}^2$.
- Physical/Logical Role: It computes the squared difference between the ground truth RTM ($M$) and the RTM predicted by the diffusion decoder ($D_d(\cdot)$). Squaring the difference ensures that both positive and negative errors contribute to the loss equally and that larger errors are penalized more heavily.
- Why used: The squared L2 norm is the fundamental component of the Mean Squared Error (MSE) loss, which is widely adopted for regression tasks due to its differentiability and convex nature, simplifying the optimization process.
-
$M - D_d(\dots)$:
- Mathematical Definition: This represents the element-wise difference between the ground truth RTM and the predicted RTM.
- Physical/Logical Role: This is the error or residual that the model strives to minimize. It's the direct comparison between the desired output and the model's actual output.
- Why used: This direct subtraction forms the basis for quantifying the error that the model needs to learn to reduce.
Step-by-Step Flow
Let's trace the journey of a single abstract data point through the GLD-RT mechanism, from input to loss calculation:
-
Initial Data Input: The process begins with a single Color Fundus Photography (C-FP) image and its corresponding ground truth Retinal Thickness Map (RTM), $M$, obtained from an Optical Coherence Tomography (OCT) scan.
-
Multi-Modal Registration & Cropping: The C-FP image undergoes a precise registration process to align it pixel-wise with the RTM's spatial coordinates. This involves using an intermediate Infrared Fundus Photography (IR-FP) image as a reference. Key steps include segmenting retinal vessels, detecting keypoints (e.g., using AKAZE), computing homography matrices (e.g., with RANSAC), and non-rigidly registering the full C-FP ($C\text{-}FP_{global}$) to the IR-FP. From this, a cropped version, $C\text{-}FP_{macular}$, is generated, focusing specifically on the macular region that corresponds to the RTM.
-
Parallel Feature Extraction:
- Global Context Stream: The full $C\text{-}FP_{global}$ image is fed into the Global Full-Fundus Encoder ($E_g$). This encoder, which leverages a pre-trained RETFound Vision Transformer, processes the image to extract high-level semantic features, $F_g$. These features encapsulate the overall retinal structure and broader contextual information.
- Local Detail Stream: Simultaneously, the cropped $C\text{-}FP_{macular}$ image enters the Local Macular Encoder ($E_m$). This encoder, built with a Swin-Transformer and Feature Pyramid Network, extracts fine-grained, hierarchical features, $F_m$, providing detailed information specific to the macular region.
-
Noise Injection (Training Phase Only): If the model is in its training phase, a random timestep $t$ is selected from a predefined noise schedule. Gaussian noise, scaled according to this timestep, is then added to the ground truth RTM, $M$, resulting in a noisy RTM, $M_t$.
-
Conditional Denoising by Diffusion Decoder: The noisy RTM, $M_t$, along with the chosen timestep $t$, and the extracted conditional features ($F_m$ and $F_g$), are all passed into the Diffusion Decoder ($D_d$). The decoder's primary task is to learn to "denoise" $M_t$ back towards the original, clean RTM, $M$. This denoising process is critically guided by the rich contextual information provided by $F_m$ (local details) and $F_g$ (global context).
-
RTM Prediction: The decoder outputs its best estimate of the original RTM, which we can denote as $D_d(M_t, t, F_m, F_g)$.
-
Loss Calculation: The predicted RTM is then compared directly to the original ground truth RTM, $M$. The squared L2 norm of their element-wise difference, $||M – D_d(M_t, t, F_m, F_g) ||^2$, is computed. This value represents the error for this specific data point.
-
Batch Averaging: This individual squared error is then averaged across all samples within the current training batch (each with its own $M$, $t$, $F_m$, $F_g$ combination) to yield the final loss $\mathcal{L}$ for that iteration.
-
Inference (Generation Phase): During inference, the process for the diffusion decoder changes. Instead of starting with a noisy version of a ground truth RTM, the decoder begins with pure random noise. It then iteratively applies the denoising steps, guided by the $F_m$ and $F_g$ features extracted from a new C-FP input. This iterative process, often using a non-Markovian deterministic sampling approch like DDIM, gradually transforms the initial noise into a coherent and detailed RTM prediction over a significantly fewer number of steps (e.g., 5 steps).
Optimization Dynamics
The GLD-RT mechanism learns, updates, and converges by iteratively minimizing the Mean Squared Error (MSE) loss function, $\mathcal{L}$, through a process of gradient-based optimization.
-
Loss Landscape: The model's learning takes place within a complex loss landscape. This landscape is shaped by the intricate relationship between the ground truth RTMs, the varying levels of noise introduced at different timesteps, and the rich, multi-scale conditional features extracted from the C-FP images. The ultimate goal is to navigate this landscape to find a set of model paramaters (weights and biases within the encoders $E_m$, $E_g$, and the diffusion decoder $D_d$) that correspond to a "valley" where the predicted RTMs consistently align closely with the ground truth. While the overall landscape of deep neural networks is inherently non-convex, the MSE objective provides a clear, differentiable signal for optimization. The inherent structure of the diffusion process, which involves learning to denoise across a spectrum of noise levels, acts as a powerful regularizer, potentially leading to a smoother and more robust loss landscape compared to simpler direct regression models.
-
Gradient Calculation: In each training iteration, after the loss $\mathcal{L}$ is computed for a given batch of data, the process of backpropagation is initiated. This algorithm efficiently calculates the gradients of the loss with respect to every trainable parameter within the encoders ($E_m$, $E_g$) and the diffusion decoder ($D_d$). These gradients are crucial; they indicate the precise direction and magnitude by which each parameter needs to be adjusted to reduce the calculated loss.
-
Parameter Update: The paper specifies that the Adam optimizer [16] is used to update the model's parameters. Adam is a sophisticated adaptive learning rate optimization algorithm. It dynamically computes individual learning rates for different parameters by maintaining exponentially weighted averages of past gradients (the first moment) and past squared gradients (the second moment).
- The specific hyperparameters for Adam are set to $\beta_1 = 0.9$ and $\beta_2 = 0.999$, which are widely accepted default values.
- To manage the learning rate effectively, a cosine decay scheduling strategy is employed. This schedule is applied after an initial 16-epoch "warm-up" phase, during which the learning rate gradually ramps up from a very small value ($1 \times 10^{-8}$) to a slightly larger one ($6 \times 10^{-5}$). Following this warm-up, the learning rate slowly decays according to a cosine function over 300 epochs. This strategy allows the model to initially explore the loss landscape cautiously, then accelerate convergence, and finally fine-tune parameters by reducing the learning rate, preventing overshooting the optimal minimum.
- Additionally, a fixed weight decay of $1 \times 10^{-2}$ is applied. Weight decay, also known as L2 regularization, helps to prevent overfitting by penalizing large parameter values. This encourages the model to learn more generalized and less complex features, improving its performance on unseen data.
-
Iterative Refinement and Convergence: This cycle of calculating the loss, computing gradients, and updating parameters is repeated iteratively over many training epochs (300 epochs in this study). As training progresses, the model's parameters are continually refined to minimize $\mathcal{L}$. The diffusion decoder progressively learns to accurately reverse the noise process, becoming increasingly proficient at predicting $M$ from $M_t$ when conditioned on $F_m$ and $F_g$. The model is considered to have converged when the loss on both the training and validation datasets stabilizes or reaches a minimum. This indicates that the model has successfully learned to generate RTMs that closely match the ground truth, demonstrating its ability to capture the underlying retinal thickness distributions. The adoption of the Denoising Diffusion Implicit Model (DDIM) for sampling during inference, a non-Markovian and deterministic process, further contributes to practical convergence by enabling faster and more stable generation of RTMs with significantly fewer steps (e.g., 5 steps), making the mechanism more efficent for real-world application.
Results, Limitations & Conclusion
Experimental Design & Baselines
The GLD-RT model was developed and rigorously validated using a comprehensive dataset. For the core RTM prediction task, the researchers utilized 2,918 data triplets, each comprising corresponding Optical Coherence Tomography (OCT), Infrared Fundus Photography (IR-FP), and Color Fundus Photography (C-FP) images. These triplets were sourced from 1,418 Diabetic Macular Edema (DME) patients undergoing anti-VEGF therapy at Kangbuk Samsung Hospital. The cohort exhibited a mean retinal thickness of $296.99 \pm 30.67 \text{ µm}$ and a central macular thickness of $292.46 \pm 75.00 \text{ µm}$, indicating a significant prevalence of macular edema. The IR-FP and 31 OCT B-scans were acquired using Heidelberg devices, which automatically provide membrane segmentations. Experienced ophthalmologists carefully excluded scans with poor fixation or segmentation errors to ensure data quality.
For the crucial task of DME diagnosis, the Mobile Brazilian Retinal Dataset (mBRSET) was employed. This dataset consists of 5,164 C-FP images from 1,291 diabetic patients in Itabuna, Bahia, Brazil, all meticulously annotated with DME diagnosis and image quality labels.
Data pre-processing involved several steps to ensure consistency and alignment. IR-FP images were centrally cropped to $544 \times 544$ pixels, matching the OCT scanning area. C-FPglobal images were downsampled from $3608 \times 3608$ to $544 \times 544$ to match the IR-FP resolution. Retinal Thickness Maps (RTMs) were computed from 31 B-scan lines and linearly interpolated to match the IR-FP resolution. To preserve structural integrity while reducing artifacts, RTMs underwent sequential smoothing using Gaussian filtering ($\sigma = 3$) followed by non-local means denoising. For DME diagnosis, C-FP images were cropped to $800 \times 800$ based on fovea location and then downsampled to $544 \times 544$.
The dataset was split at the patient level for robust evaluation: 2043 training, 292 validation, and 583 testing triplets for GLD-RT development. The mBRSET was similarly split into 2409 training, 345 validation, and 688 testing images for DME diagnosis. The GLD-RT model was optimized using the Adam optimizer [16] with standard parameters $(\beta_1, \beta_2) = (0.9, 0.999)$, a cosine decay learning rate schedule after a 16-epoch warm-up, and a fixed weight decay of $1 \times 10^{-2}$. The diffusion process utilized 20 timesteps for training and 5 for inference. All experiments were conducted on NVIDIA GeForce RTX 3090 GPUs, incorporating data augmentation via random flipping and rotation.
To ruthlessly prove their mathematical claims, the authors pitted GLD-RT against several established and state-of-the-art (SOTA) models. For RTM prediction, the "victims" included general medical image dense prediction models like UNet [23], Trans-UNet [5], and Swin-Unetr [12], as well as specialized RTM prediction frameworks such as DeepRT [15] and M²FRT [26]. These baselines were evaluated with various input configurations (IR-FP, C-FP, or both) to provide a comprehensive comparison. For DME diagnosis, the GLD-RT-assisted approach was compared against a C-FP-only baseline using a ResNet50 [13] classifier.
What the Evidence Proves
The experimental evidence definitively proves that the proposed Global-to-Local conditional Diffusion model for Retinal Thickness prediction (GLD-RT) significantly outperforms existing methods in predicting RTMs from Color Fundus Photography (C-FP) and offers substantial benefits for DME diagnosis.
For RTM prediction, GLD-RT achieved superior performance across all retinal regions (G1, G2, G3, corresponding to the ETDRS grid) when evaluated using Mean Absolute Error (MAE) in micrometers ($\mu$m) and Peak Signal-to-Noise Ratio (PSNR) in decibels (dB). Specifically, GLD-RT, using only C-FP as input, recorded an overall MAE of 20.08 $\mu$m and a PSNR of 30.91 dB. This was a marked improvement over the previous SOTA, M²FRT [26], which achieved an overall MAE of 23.21 $\mu$m and PSNR of 29.34 dB with C-FP input. The statistical significance of these gains was confirmed with p-values less than 0.01, indicating that GLD-RT's performance was not due to chance.
The most compelling evidence of GLD-RT's core mechanism working in reality lies in its performance in the foveal region (G1). This area is clinically critical due to its complex layered structure and direct impact on central vision. Here, GLD-RT achieved an MAE of 31.97 $\mu$m and a PSNR of 30.18 dB, demonstrating a substantial improvement over M²FRT's 36.25 $\mu$m MAE and 28.31 dB PSNR for C-FP input. This indicates that GLD-RT's dual-stream architecture, integrating global context with fine-grained local features via a hierarchical diffusion decoder, effectively captures the subtle and irregular retinal anatomy crucial for accurate thickness quantification in this challenging region.
Qualitative results, as depicted in Figure 2, further underscore these gains. GLD-RT robustly detected thickness variations associated with diverse pathological lesions, such as Drusen, Macular Edema, and Branch Vein Occlusion, providing more accurate representations of retinal anatomy compared to M²FRT. The difference maps (prediction minus ground truth) consistently showed smaller errors for GLD-RT, visually confirming its superior fidelity.
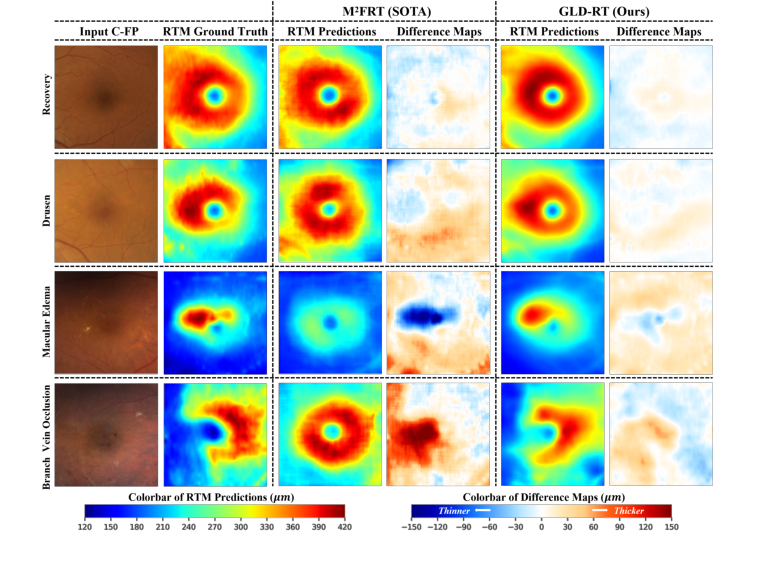 Figure 2. Qualitative results of our model and M2FRT. GLD-RT robustly detects diverse pathological lesions and accurately depicts subtle and irregular retinal anatomy. Dif- ference maps (prediction minus ground truth) further underscore these gains
The ablation study provided definitive evidence for the contribution of each architectural component. The backbone (Em, Dnd, i.e., local macular encoder with a decoder without diffusion) already outperformed M²FRT, validating the effectiveness of the enhanced local feature extraction. The addition of the diffusion decoder (Dd) significantly improved performance, particularly in G1, proving the diffusion process's ability to capture fine macular details. Furthermore, incorporating the global full-fundus encoder (Eg) with RETFound pre-training further boosted performance, highlighting the critical role of domain-specific pre-training and global anatomical consistency. The full GLD-RT model, combining Eg (RETFound), Em, Dd, consistently yielded the best results.
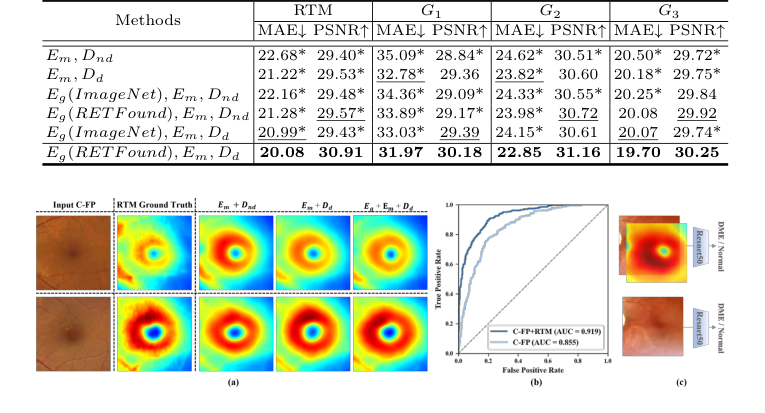 Figure 3. (a) Qualitative results of ablation study on GLD-RT. The proposed Dd sig- nificantly enhanced fine macular structural details, while Eg further enforced global anatomical consistency. (b) Receiver operating characteristic curve of DME diagnosis. (c)Experiment design of DME diagnosis
Beyond RTM prediction, GLD-RT-generated RTMs proved invaluable for DME diagnosis. When concatenated with C-FP as a dual input for a ResNet50 classifier, this approach consistently outperformed a C-FP-only baseline. The dual-input model achieved an accuracy of 93.44% (vs. 92.21%), recall of 79.49% (vs. 64.41%), an F1-score of 85.90% (vs. 75.84%), and an AUC of 0.919 (vs. 0.855). This undeniable evidence demonstrates that C-FP-generated RTMs provide complementary diagnostic insights, aligning with clinical protocols that often require both OCT and C-FP examinations. This makes GLD-RT a promising, cost-effective diagnostic tool, particularly for resource-constrained settings.
Limitations & Future Directions
While GLD-RT presents a significant leap forward in predicting retinal thickness from C-FP and aiding DME diagnosis, it's important to acknowledge its current limitations and consider avenues for future development.
One inherent limitation, though addressed by the model's purpose, is that C-FP, being a 2D imaging technique, fundamentally lacks the depth resolution of OCT. While GLD-RT effectively infers thickness, the ground truth RTMs are derived from high-resolution OCT scans. The paper itself points to "incorporating higher-resolution OCT for detailed RTM prediction" as a future direction, suggesting that even with GLD-RT's advancements, there might be a ceiling to the detail achievable solely from C-FP without further technological integration or higher-fidelity ground truth. The current model, while robust, is still a prediction based on a 2D input, and its ability to capture every minute detail of complex 3D retinal structures might be constrained.
Another aspect to consider is the generalizability of the findings. The model was trained on datasets from specific hospitals and regions (Kangbuk Samsung Hospital and mBRSET). While these are substantial datasets, real-world clinical practice involves a vast diversity of patient demographics, disease severities, and imaging devices from various manufacturers. The performance of GLD-RT on external, unseen datasets from different populations or with varying image acquisition protocols would require further prospective clinical validation. The paper mentions "prospective clinical validation" as a future direction, which implicitly acknowledges this need for broader testing.
Furthermore, while the model provides RTMs, the clinical workflow for interpreting these AI-generated maps alongside traditional C-FP images needs to be established. Clinicians are accustomed to OCT-derived RTMs, and the transition to C-FP-generated RTMs will require clear guidelines and training to ensure accurate interpretation and integration into treatment decisions. The paper's suggestion of "integration into existing healthcare workflows" highlights this practical challenge.
Looking ahead, several exciting discussion topics emerge from this work:
- Enhanced Clinical Integration and Decision Support: How can GLD-RT be integrated into existing electronic health record systems to provide real-time RTM predictions during routine C-FP screenings? Could the model be extended to not just predict thickness but also to automatically highlight regions of concern or suggest follow-up actions, thereby acting as a more comprehensive decision-support tool for primary care physicians or even patients in home monitoring settings? What are the regulatory pathways and ethical considerations for deploying such an autonomous diagnostic aid?
- Multi-Disease Prediction and Biomarker Discovery: Given GLD-RT's success in leveraging C-FP for DME, can this framework be adapted or extended to predict other retinal pathologies or biomarkers that are currently reliant on more expensive or invasive imaging? For instance, could it predict early signs of glaucoma (e.g., retinal nerve fiber layer thinning) or age-related macular degeneration (e.g., drusen volume) from C-FP? This could transform C-FP into a truly multi-purpose screening tool.
- Robustness to Image Quality and Artifacts: Real-world C-FP images often suffer from varying quality due to patient cooperation, media opacities, or suboptimal camera settings. While the current study filtered out poor-quality scans, future work could focus on making GLD-RT more robust to these imperfections, perhaps by incorporating image quality assessment modules or training with a wider range of degraded images. How can the model maintain its high accuracy even when presented with less-than-ideal input?
- Computational Efficiency and Edge Deployment: The current model runs on an NVIDIA GeForce RTX 3090. For widespread adoption in resource-constrained settings or for portable devices, optimizing the model for lower computational footprints and faster inference times would be crucial. Could knowledge distillation or model quantization techniques be applied to create a lighter version suitable for edge computing, potentially enabling real-time RTM generation on a smartphone-attached fundus camera?
- Longitudinal Monitoring and Treatment Response: Can GLD-RT be used for longitudinal monitoring of DME patients, tracking changes in retinal thickness over time to assess treatment response or disease progression? This would require validating the model's consistency and sensitivity to subtle changes over extended periods. How might the model's predictions inform personalized treatment strategies, optimizing anti-VEGF injection schedules or other interventions?
- Explainability and Trust: As AI models become more integrated into clinical practice, understanding why a model makes a certain prediction is vital for building trust among clinicians. Future research could explore methods to enhance the explainability of GLD-RT's RTM predictions, perhaps by visualizing the features the model attends to in the C-FP image, thereby providing clinicians with greater insight and confidence in its outputs.
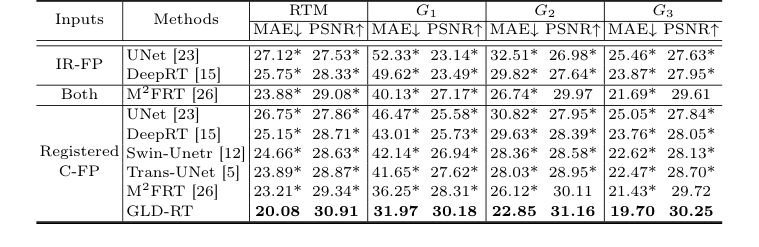 Table 1. Quantitative comparison of different methods for RTM prediction, with MAE (µm) and PSNR (dB). * indicates GLD-RT outperforms baselines with p-values<0.01
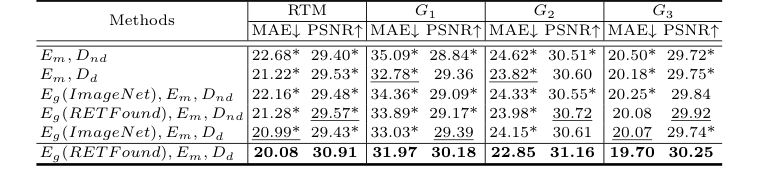 Table 2. Ablation study of RTM prediction, with MAE (µm) and PSNR (dB). * indicates GLD-RT outperforms baselines with p-values<0.01